
Sparkify: Should I stay or should I go?
Project Overview
All user interaction with Sparkify revolves around these activities:
* Play a song
* Creating and updating playlists
* Rating song with the thumbs up or thumbs down button
* Add a friend
* Logging in or out
* Changing settings
Each of these activities generates an entry into the user logs. Naturally, log analytics are a key factor for the Sparkify marketing team and all the executive staff. The team at Udacity has provided a test dataset for our analysis, although little documentation has been provided on the dataset.
Business Understanding
Realistically, there is one main question we want to
answer: Will either a paying or free user leave? That is
called churn and apps like Sparkify live and die by the
churn rate.
Along the way, I'll load and examine to data looking to clean the dataset for further examination. After this, EDA (Exploratory Data Analysis) will take place to better understand the data and prepare it for creating several machine learning models that will help to understand which customers are likely to churn.
I'll be looking for the best "F1" score, which is a measurement of the accuracy of a data model to evaluate the best model. After that, I'll present my conclusions along with ideas for further improvement.
SPARK!
I'll be using a Spark, which is an open source framework for distributed data processing. This allows potentially large and geographically dispersed data to be accessed and analyzed seamlessly by the developer. This allows for data to scale to very large sizes, yet users are able to use this data without needing to be aware of this dynamic.Developers that use the Spark ecosystem can focus on the domain-specific data processing business case, while Spark will handles the messy details of parallel computing, such as data partitioning, job scheduling, and fault-tolerance. This supports the flexibility and scalability needed to handle massive volumes of data efficiently.
Pyspark is the Python API to Spark, which allows all of the attendant benefits of Python and it's libraries to be used with Spark. It's a happy marriage!
The folks at Data Flair have a nice infographic that shows the highlights of Spark.

My Python/Pyspark code is here at Github: https://github.com/nameisunique/Capstone_Sparkify
Data Understanding and Data Cleaning
A few thoughts:1) For my analysis, I took a "low level" approach with python in addition to using a number of useful functions provided by Pyspark.. Those can be very helpful tools for initial understanding, and usually the first place I investigate data from.
2) For the initial data loading and cleaning, I use a variety of Python functions to look for nulls, missing data, outliers, and data that needs to be removed. Potentially I may need to use some statistical techniques to extrapolate (or impute) missing values; for this data I did not impute any values.
Data Findings
This is my initial set of findings about the dataset. Since the documentation about the log records was not present, potentially this would be updated as more is known about the dataset.This also presents a minor quandary. What fields/features should I drop, if any, for the upcoming models? In other binary classification problems I've worked on at my job, we tend to initially leave most or all of the columns in. Especially when there is little to nothing known about the dataset. At present, there are 18 columns. There are potentially a few "easy" ones to drop. For example, I could drop the first and last name. I doubt they will be a very important feature. However, being more inclusive than less is the direction I'm going.
Here's what has been surmised around a user:
- User Id : User identifier
- firstName: Users first name
- lastName: Users surname
- gender: either M or F
- location: not known if this comes from the IP address or user provided. Leaning towards from the IP address
- userAgent: OS/method used to access Sparkify. (57 different categories)
- registration: UNIX/epoch time stamp for presume initial registration
- level: user subscription status (free or paid)
- ts : timestamp of a given log
- page : type of web/app page access (19 categories)
- Cancel
- Submit Downgrade
- Thumbs Down
- Home
- Downgrade
- Roll Advert
- Logout
- Save Settings
- Cancellation Confirmation
- About
- Settings
- Add to Playlist
- Add Friend
- NextSong
- Thumbs Up
- Help
- Upgrade
- Error
- Submit Upgrade
- auth : authentication status (4 categories)
- sessionID : what session for the log
- itemInSession : a counter maintained for what looks like a given session
- method : http method
- status : looks like the http status code;
- song : song name
- artist : artist name
- length: song's length (seconds)
Interesting findings so far
The fields below had null, meaning no values, in them.
I believe that the reason the artist/length/song field
count is so high is that the user may have either
skipped the song before it had a chance to play or it
was indeed an empty value. I would need to take this
back to the team that puts the log file together to
understand the Artist/Length/Song field dynamics. Since
they are all the same value (58392), it's a likely
conclusion that whatever the issue is causing it is the
same for all songs/artist/length.The other same count number (8346) are less than 3% of the records in the dataset (it's count is 286,500) so I removed those rows. I believe this to be an issue with how the registration process is set up, so back to the data log file team.
I made a decision here NOT to remove any of the columns. For initial work with a dataset, especially one that I don't have much (or in this case any) information about, I prefer to use all the fields once I've cleaned the dataset. Later, depending on how the ML analysis goes, I may remove some of the fields. For example, first and last name. Note: I also address data privacy in the conclusion; that might be another reason to remove the names.
Fields with missing values
- artist : 58392
- firstName : 8346
- gender : 8346
- lastName : 8346
- length : 58392
- location : 8346
- registration : 8346
- song : 58392
- userAgent : 8346
Exploratory Data Analysis (EDA)
The first item of business is to define a new column as "Churn" and populate it from the appropriate field. Here is an example of 5 records with the new field Churn populated. It is populated from the Page column and the value of "Cancellation Confirmation" being present was used. (I've split the full graphic into 2 parts due to width)


Churn Defined
- 1 - users who cancelled their subscription within the observation period
- 0 - users who kept the service throughout
So these are the 19 columns that we have to work with. The data set is now cleaned, meaning the nulls and/or empty strings have been removed. At this stage, still knowing little about the dataset, I prefer not to change or impute any/many data values. As well, outliers are a bit tough to identify without further information. For example, the "Length" field represents the length of time (in seconds I believe) that a song is play. If the average length of a song is 4 minutes, 30 seconds and I come across one that is 15 minutes in length what is the best decision with what we presently know about the dataset? I would say we keep it, and flag that as a field in question.
In the world of Data Science, there are long chapters in books and active debates on how to handle missing or absent data. For some types of data, one can "impute" values; looking at surrounding similar data and using statistics to come up with often accurate replacement data. In this case, imputing the fields would not be recommended due to still having a lack of understanding of the surrounding data that exists to do the imputation.
Explore
potential features
Part of EDA is looking to get an understanding of the
data. I know that I have a 18 fields that contain many
of the fields that I'm interested in. This is just a
broad brush view of these fields, I'm just looking to
get a base understanding, so I'll do a variety of
groupings to examine relationships in my data. My
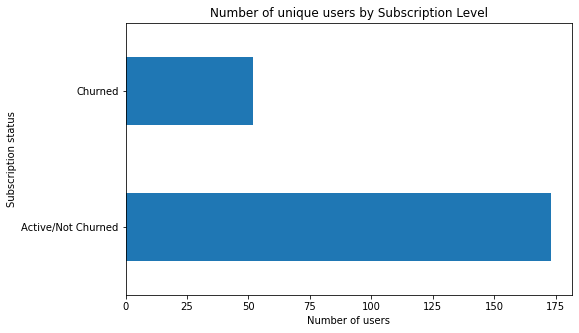
primary concern is looking for any patterns or relevancy
to churn.Here is a visual of the unique subscribers, and remember this is a smaller dataset. A Big Data dataset would potentially have millions of subscribers; same analysis, just larger numbers. This visual gives me an understanding of the ratio of churned to non-churned subscribers. At an initial glance, I see that my churn level, while lower than non-churned is still higher that I'd like to see. Let look further.
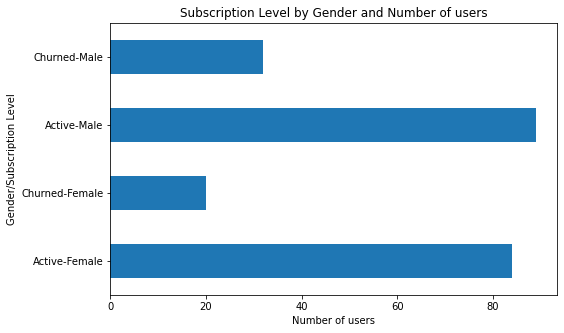
Here's an analysis by gender. As a trend, more males
churn than females. Of the active users, they are pretty
close. I'll want to consider gender as one of my
features I'm pretty sure now.
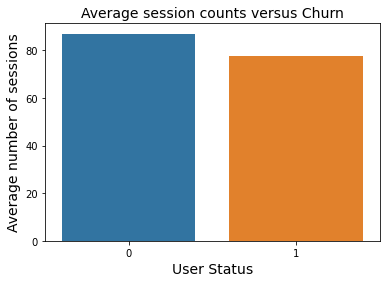
As a side note, in the world of visualizations, there are a variety of libraries to choose from. Below is a visual from a library known as Seaborn, which some users prefer due to large variety of visualizations available. There is a term in the visualization world known as "eye candy", and while nothing is wrong with that, I find that I tend to prefer the simpler visualizations since they are usually quicker to set up and to me, convey the same information.
Remembering that 0 represents Non-Churn users, and 1 represents Churned users, this visual looks at the average number of sessions. This numeric view gives me insight into sessions of churned vs non-churned users. A session is when a user logs in and does some activity or actions. As I would expect, the more engaged users, shown by the blue non-churned users outnumber the orange churned users. But barely, so something causes the users to churn even though they are active. Another feature to investigate.
This visual provides both a view of the actions a user can take besides playing songs and gives a great overview of the activity levels and types of activity from users in general, as well as specifically broken down by churned vs active users. There were a few areas I wanted to investigate here:
- The ratio of thumbs up vs thumbs down. I thought this important since larger number of thumbs down would make me wonder about Sparkify's overall selection of available music. However, the positive delta in favor of thumbs up makes me think that there is a good to very good selection of music. Although the higher number of thumbs down for churned users gives pause for thought about what is the profile of a churned user. Why are the more dissatisfied (as measured by Thumbs Down) that the non-churned user.
- How much upgrading was done? Which here was not much, and more churned users cancelled their subscription than non-churned.
- How much downgrading was done? More downgrades, and an almost equal number of churn to non-churned users here. Does this mean they don't see value in the paid service?
- How about Add Friend? There was more activity here that I would have initially guessed. I would have also expected less churned users here, since I would think a user would more likely add a friend if they liked the Sparkify app.
- What is the overall page activity?
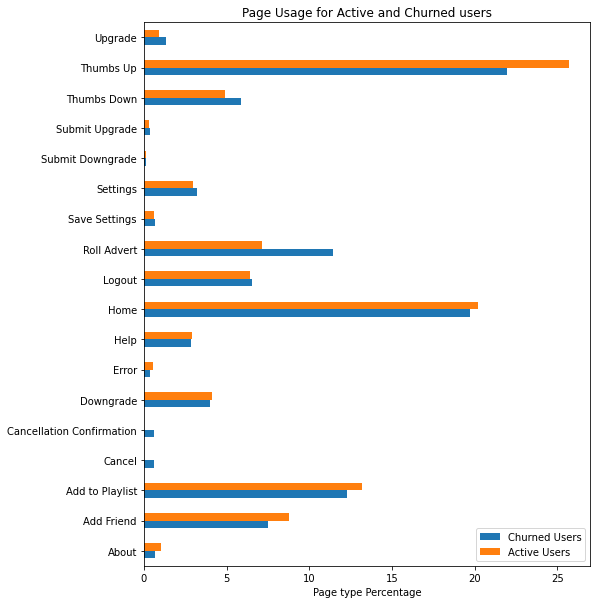
This was a good visual, since it shows the activity beyond the playing of songs; we presume there is either a separate page or section in the app that covers selecting a song.
Notes from EDA
1) We have more customers staying active than churning.2) Believe that the churn rate is still too high.
3) Males both churn or stay active at a higher rate than females.
4) The free users both churn or stay active at a higher rate than the pay users.
5) Page analysis shows that the ratings system (thumbs up/down) is popular.
6) This is followed by adding to a playlist and adding a friend.
7) Session count is higher for the active customers, although the churn customers have a faily high amount as well.
Feature
Engineering
Feature Engineering is getting data selected and prepared for a machine language model. This is very much an iterative process, as you will want to add and/or subtract features that enhance the accuracy and performance of your model.
Popular feature engineering tasks are:
- Imputation
- Handling Outliers
- Binning
- Log Transform
- One-Hot Encoding
- Grouping Operations
- Feature Split
- Scaling
- Extracting Date
After
analyzing all the columns I decided to use below
features in my models:
- Gender: Usually a given for initial model build
- UserAgent: This field gave OS/method used to access Sparkify. (57 different categories). May be useful since it is the closest info we have on what kind of device is being use by the user.
- Status: I included this since getting to the wrong app page is often considered a big negative.
- Page: Used this since it covers the activity types.
Once
the columns were identified, we now have to make sure
that they are all numeric datatype so that they could be
put into the model that we choose. The Gender, UserAgent
and Page columns had to be converted into numeric values
using a combination of String Indexing and One Hot
encoding.
I chose just 4 features since we really didn't know much
about the dataset, and my preference is to start small
and increase the number of features. As mentioned, this
method, while potentially taking longer, I find useful
in the long run in creating models.
Side
note: At work, we use AutoAI more frequently
(https://www.ibm.com/cloud/watson-studio/autoai), which
does all the activities that I've done up to this point,
and will continue to building and tuning the model. The
robots are taking over! :-) But I'm seeing the overall
concept of AutoAI becoming popular very quickly since it
will do both feature engineering and hyperparameter
tuning both quickly and with increasingly accurate
results. One of the improvements I'll suggest is taking
this data and doing an experiment with Watson Studio
AutoAI and comparing results. Binary classifications are
one of the areas that I'm seeing AutoAI being very good
at.
Side
note #2: As a long time SPSS user, AutoAI in a more
limited capacity has been available for a number of
years. I would use it to help rank features which would
help lessen the time on feature engineering as well as
having SPSS do initial "best model" auto-selection.
A brief thought about assumptions
I think it's important to make sure to document assumptions made in any sort of data exploration or setting up machine learning models.As noticed, I have a small set of features initially. First, I've generally started small with number of features chosen when doing feature engineering; I've learned the hard way that "throwing a bunch of features at the wall and seeing which one sticks" can just over-complicate and extend the time to develop a usable model.
As well, we don't have much background either on this dataset or the way the Sparkify app is used. So, I would rely on what I found during the Exploratory Data Analysis, and in my case many of the visuals, to see what I can apply to the overarching business problem here: "How can identify and reduce churn?".
I will continually stand by the idea that feature engineering and model building are an iterative process. I think that sometimes since it often takes so long to actually do the Data Wrangling and EDA that there's almost a gleeful rush to build models. Then when the models perform poorly, or need a lot of retraining, that overall cycle nets out to take more time than if we started smaller doing the feature engineering and model building.
Modeling
We finally get to modeling!
We
have a simple but key business need here. Answer the
binary yes or no question: "Will a customer churn?".
This represents a dynamic on two important fronts:
- How can we keep existing customers from churning?
- How can we prevent future customer from churning?
There is another good question, which the overall project attempts to do: "What can we identify as causing churn?". As mentioned in the assumption section a moment ago, I think it important, especially during the early phases of a project such as this, to look at the results found during the Wrangling and EDA process as it is to try and identify all the "correct" features.
There
is also a another key question that would require
potentially more data and analysis which is "How can we
get free customers to become paid customers?". As they
saying goes, that is beyond the scope of this exercise.
However, that would be my next step.
Back
to the question at hand, how to prevent churn. I've
chosen three good classification models to use for this
exercise:
- Logistic regression
- Random Forest
- Gradient Boost Tree Classifier
Additionally, I needed to prepare my features chosen for use in my ML pipelines, so I used both string indexers and one-hot encoders to create the indexers needed for my pipeline assembly.
Model Results
A note on scoring
There are a variety of technique used to determine how well an ML performs. The popular measures include
- Accuracy
- Precision
- Recall
- F1
Two concepts help explain. The first is a confusion matrix that shows the predicted versus actual results of our churn models. Remember, we know the actual results since our training set includes them.
When we run our models, we split the Churn dataset into a testing and training dataset. We take the testing data and make our churn predictions. Then we compare the results against the training data, which contains the actual result.
To view our results visually, we can use a Confusion Matrix. We can see the how our predicted results compare to our actual results. Those terms are defined below.

- True Positive: We predict churn and that matches the actual churn value
- False Positive: We predict churn, but the customer did NOT churn
- True Negative: We predict Not-Churning and the customer did not churn
- False Negative: We predict Not-Churning and the customer Did churn
We have 4 measures that reflect the confusion matrix results:
Accuracy: The ratio of predicted to actual results
Precision: the ratio of correctly predicted positive observations (True Positives) to predicted positive observations, both correct (True Positives) and incorrect (False Positives).
Recall: the ratio of system generated results that correctly predicted positive observations (True Positives) to all observations in the actual malignant class (Actual Positives).
F1: The balance between Precision and Recall.
Expressed mathematically, we have these measures:

So, what is best? The general question is what is the affect of false negatives on the business model. In our case, how "critical" do we consider false negatives. In the world of customers, most business would say that that the cost of losing a customer is far greater than the cost required to gain a customer. In other words, the cost of a customer churning is high.
In terms of Precision and Recall, this is the popular thinking:
- Recall should be optimized over precision when there is a high cost associated with a False Negative
- Precision should be optimized over recall when there is a high cost associated with a False Positive
Logistic Regression
If you look in my github at the python/pyspark code, for logistic regression I created a number of visuals beyond just calculating the F1 score. There are a good variety of statistical outputs available after the Logistic Regression model has been run.For example, I'm able to visually display the ROC curve...

As well as the Precision vs Accuracy curve...

For our project, the F1 score was the main metric and you can see that result here.

Giving credit where credits due, this blog was a great help to both show these metrics as well as how to retrieve metrics from ML runs: https://towardsdatascience.com/machine-learning-with-pyspark-and-mllib-solving-a-binary-classification-problem-96396065d2aa
Random Forest Classifier
I'll be the first to admit that this is one of my favorite classifiers, maybe since I like the name. :-) That said, the Random Forest Classifier uses a Parameter Grid, which provides a grid of parameters for the pipeline to search. Very handy, especially when you are evaluating a lot of different ML parameters.
For Random Forest Classifier, I used what was generally accepted as good set of parameter for this model:

The F1 score here was .8545, just a small bit better than the Logistic Regression.
Gradient Boost Tree Classifier
Contestant number three, aka GBT Classifier, and I chose it since I see it as a good classification model. I only set one parameter for the GBT Classifier (maxIter = 10) and somewhat to my surprise, GBT produced the best F1 score!
F1 score for Gradient Boosting Tree Classifier is: .8619
Since this model performed the best, I chose it to be the candidate for further tuning.
Tuning
If you Google "pyspark or python hyperparameter tuning", you will find a vast array of articles, blogs, even books on parameter tuning. It's a fascinating topic and one that I'll recommend you look at the reference section in my github code for further review.
For the GBT Classifier, I primarily used a reference recommended by one of the Udacity mentors: https://machinelearningmastery.com/hyperparameters-for-classification-machine-learning-algorithms/ as well as https://towardsdatascience.com/build-an-end-to-end-machine-learning-model-with-mllib-in-pyspark-4917bdf289c5 Both provided good insight into how to approach tuning a GBT Classifier.
For my parameter grid, I chose:

As expected, this added significant time to my GBT Classifier run, which I would look closely at for the much larger datasets I expect to be running once we start processing in a Big Data environment. But my tuning run produced two good items of information.
First, I'm able to extract from the parameter map the best set of parameters, which turn out to be:
- maxBins: 32,
- maxDepth: 20,
- maxIter: 30
Final F1 scores:
- Logistic Regression F1 Score: .8512
- Random Forest Classifier: .8545
- Gradient Boosted Tree Classifier: .8619
- Tuned Gradient Boosted Tree Classifier: .8999
Thoughts on the F1 scores
As mentioned earlier in the overview of scoring (Accuracy, Precision, Recall, F1), F1 represents the most useful measure of the model. I believe this is an appropriate measure for us in the context of the business case, since both False Negative and Positive have a potentially derogatory effect on the Revenue and reputation of Sparkify.
For F1 Scores, the measure is from 0 to 1. A "0" is considered absolute failure, and "1" is considered absolute success. FYI, I've never seen either.
In our case, since we are evaluating several models, F1 score also serves as a good metric to compare the models. All models produce the True/False Positive and True/False Negative measures, so we have a good "apples to apples" comparison method with F1.
Note on Feature Engineering and the future
So we have a winner with the Tuned Gradient Boosted Tree Classifier. I'd likely expect that we'll got through the tuning process several times more as we finalize the decision on which features we want to use to predict churn. I've always found that the selection of features for feature engineering is best started with conversations with the business side. In this case, I would look to sit down with the Sparkify app team as well as the marketing team to understand best how they see the app being used. It's always a possibility that we choose feature(s) that aren't really relevant to the success of the model.That's why I like to start with a small set of features and build up from there. In our case, I'd look to the metrics around the thumbs up/down, adding friends, and adding to playlist. I excluded them initially since I felt that those are metrics that show active use of the Sparkify app; my assumption would be that users that churn would be less inclined to use those features.
I'd also like to get more longitudinal data, as we just had a months worth of data. For the next set of "active use" metrics (thumbs up/down, add users|playlists), I'd like to see how that activity changes over time. Potentially I'd add a feature that showed the change plus/minus over time and see how that affects churn.
I find feature engineering to be as much "art" as science. Choosing the right mix of features is enjoyable, however I find it often is time-consuming to find the right mix.
As an SPSS user, I've been using the "Auto Classifier" to pick the correct Classification model (binary or multiclass), and that's been helpful. As well, SPSS allows a faily easy, however still time consuming way of hyperparameter tuning.
For the past year, I've also been using the "Auto AI" capabilities of Watson Studio and that shows great promise. Auto AI knows about roughly 80 classification and regressions models and does much of the data prep, the feature engineering, hyperparameter tuning, and provides all the analytics about why it chose the model it did. At the least, it allows the Data Scientist to have a jump on a good starting; if the promise holds, much of the model development and/or tuning in the future will have much of it done automatically.
Conclusion
We have a starting point with our Logistic Regression model with the F1 score of .854. As suggested, we'll use the F1 score as the initial criteria.With customer churn, the historical data is golden as we know who did and did not churn. Our data set offers us this as the basis for training our model, and we have two immediate actions we can take:
1) Look at the current customers and create an assessment of who will be likely to churn based on using our model. Those customers may need some further incentive to stay, such as a financial incentive for our paying customers and a reduction in ad frequency for our free customers.
2) Examine all new customers and make an assessment of their likelihood to churn.
Sparkify managment also needs to review their free customer paradigm. We were not provided the data the shows how profitable free vs. paying customer are. It's not a simple choice to say that Sparkify makes more money on the paying customers over the free customers. Potentially the ad revenue compensates more than the pay revenue; the record/music companies that supply Sparkify their music to play may offer financial incentives based on advertisement. There are many factors to consider here.
Should paying customer generate more revenue than free customers, the next model set to be built and tested would be building a prediction model to determine propensity to upgrade. Our dataset provides a good starting point for that, again that would be a binary classification problem ("Did the customer upgrade: Yes or No?")
Sparkify appears to be an active site; there are a lot of songs being played, playlists created, and friends added. All of those are potential features to continue to mine and refine. This is all part of the ML discovery process.
Pyspark and Big Data are also key elements of the technology here. Being able to assess large volumes of data via Hadoop, HDFS, and Spark represents an ability to keep tied into the Sparkify user community in an accurate and also fairly inobtrusive way via log data analysis.
Data Privacy is an element that should likely be addressed as well, as the log data set includes both name and location data. There are a number of useful data obfuscation/anonymization techniques available. Sparkify would be advised to review their data privacy policies.
Lastly, Pyspark represents a very useful way of approaching Big Data programming married with the efficiency and ease of Python programming. In the world of Data Science, both Python and SQL programming skills are both useful to have and faily plentiful in the labor market.
Sparkify is off to a good start with the approach to both Big Data and Data Science!
Improvement
These are the next areas I would improve this exercise with:1) Tuning Here's a great guide: https://medium.com/rahasak/random-forest-classifier-with-apache-spark-c63b4a23a7cc and here: https://towardsdatascience.com/an-implementation-and-explanation-of-the-random-forest-in-python-77bf308a9b76
2) Cracking the code on displaying a good, readable, "most important features" list. Here is a good start:
https://www.timlrx.com/2018/06/19/feature-selection-using-feature-importance-score-creating-a-pyspark-estimator/
3) Add more metrics for analysis
There are a lot of good metrics and evaluation metrics from MulticlassMetrics. You'll need to include:
"from pyspark.mllib.evaluation import MulticlassMetrics"
Here are some good references and code samples for getting further details
https://spark.apache.org/docs/2.3.0/api/python/_modules/pyspark/mllib/evaluation.html
and a potpourri of evaluation metrics: https://spark.apache.org/docs/2.3.0/mllib-evaluation-metrics.html
4) Sparkify needs to review their data privacy program. Good info on Python and data obfuscation/redaction:
https://medium.com/district-data-labs/a-practical-guide-to-anonymizing-datasets-with-python-faker-ecf15114c9be
https://towardsdatascience.com/revolutionising-redaction-my-final-year-project-fe664e28ef84
5) More information around the dataset. Possibly because it's very rare for me to have someone hand me a dataset saying "Here, we don't know anything about it, have at it". Well, while we do know a few things about the dataset, there is a lot we don't know. Not that it's a big problem as much as you saw in my approach to this project of starting small. The above 4 improvement areas I would undertake, although in the absence of getting more information about the dataset, as I iterate through the process of more features engineering and ML tuning, I believe that would be adding more assumptions about the dataset.
Final Thoughts
I have gained a tremendous amount of knowledge from my almost year long Udacity Data Scientist program. I find that I use what I've learned here several times a week, and in my role as a pre-sales Analytics Architect in IBM's Data and AI group, it continues to be helpful in my interactions with both Data Scientists on the technical end and Executives on the business end.The Capstone project was really interesting, although it morphed from a project that was looking at mortality rates from Covid-19 compared to other leading rates, but much of the data I really wanted to get was either in-accessible or not really of very high quality. The data that Johns Hopkins sources is accurate enough, but again gaining access was more the challenge. As well, as the findings for Covid-19 are fast changing, I found that I ended up redesigning the project several times. Another project for a rainy day! :-)
So, this Pyspark project was helpful from that a work perspective since Spark is a significant part of the Watson Studio make-up. I definitely see the value of what Spark represents, although Pyspark was a little unwieldy at times. I found that some of the metrics that I had an easy time getting with Python, Numpy, and Sci-Py were tougher to dig up.
But in the end, it all comes back to Python for me. For the longest time, C has been my favored programming language although I do so little with it these days. Similar to getting your head around pointers and references in C, once you get the slice and dice easy of Python down, there's little that one can't do.
As well, this course was a great introduction to Machine Learning. I still feel like I've a ways to go, especially around the math and theory around models. I've always enjoyed Statistics, so that element of ML has been great. One of the reviewers had mentioned the Andrew Ng online class to me, so I'll add that to the next big online learning.
Thanks for everything, really enjoyed the time here at Udacity!
Tom Sensabaugh
No comments:
Post a Comment